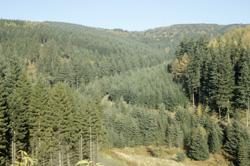
 Forest Research have developed a method of measuring forest tree species diversity to support forest managers with decision-making.
What we are providing
- Introduction to forest tree species diversity
- An overview of how to calculate species diversity
- Step-by-step instructions for measuring forest tree species diversity
Why we are providing this resource
Increasing forest tree species diversity is an important aspect of increasing our resilience to climate change and to reduce the risk from pests or pathogens.
This method allows us to:
- identify forests with low/high species diversity
- compare the potential diversity of different management approaches
- track the change in diversity over time.
Related research
ClimateXChange
Climate Change Adaptation
Tree Species and Provenance
Contact
Additional Resources
- Beauchamp, K (2016) How diverse is your forest? The Chartered Forester Institute of Chartered Foresters September 2016
- ClimateXChange (2015) CXC Indicator Indicators and trends – NF5: Planted forest tree species diversity index
Forest tree species diversity
What is species diversity?
Species diversity is measured through a combination of species richness (the number of species present) and species evenness (the abundance of each species). Species richness and evenness can be combined into a single indicator, and in ecology the Shannon Index is commonly used.
To calculate species diversity we need to know the area of the forest and the area occupied by each species. This information can come from a forest survey or from inventory data.
Species diversity can be calculated at many scales, whether for a forest management unit, the whole forest area, regionally, or even nationally.
Generally the larger the forest area the more species are present, we need to consider this when comparing forests.
Why should we measure it?
Increasing forest tree species diversity is an important component in building our resilience to climate change and to reducing the risk from pests or pathogens damage.
Measuring species diversity allows us to:
- identify forests with lower/higher species diversity
- compare the diversity of different potential management approaches
- track the change in diversity over time.
Step-by-step instructions for measuring species diversity are available.
How to Calculate Species Diversity
You first need to calculate the total area of your forest and the area covered by each species. This may be available from inventory data or you might need to carry out a forest survey.
If you have a list of smaller forest components you need to calculate the total area for each species. You can do this in Microsoft Excel or any statistical or GIS software. A worked step-by-step method using Excel is available.
Species Richness
Species richness is the number of species present in the forest. For small datasets it can be calculated by counting the number of species in your forest manually. For larger datasets we provide a worked example.
Species Evenness
Species evenness describes the relative abundance of each species. Once you have measured the area of each species in your forest you can see how evenly they are distributed. The percentage area of the most dominant species can be helpful in understanding evenness. A worked example is available.
The Shannon Index
The Shannon Index combines species richness and evenness into a single indicator. You can calculate the Shannon Index in Microsoft Excel or other statistical software.
We provided an example and step-by-step example using Excel which you can download below.
