Tools and Resources
From April 2012, accidents involving absence from work of at least seven days are required to be reported to the Health & Safety Executive (HSE). Prior to this time, reporting was required for absences of at least three days.
Accident rates in forestry and wood products have tended to decline in recent years, but are still higher than the averages in agriculture and manufacturing respectively (Table 7.3 and Figure 7.1).
Table 7.3 Accidents to employees in forestry and wood processing2, 2011-12 – 2015-16
| Standard Industrial Classification (SIC)1 | Major Accidents3 | Total Reported | ||
| Number | Rate/1000 employees | Number | Rate/1000 employees | |
| Forestry | ||||
| 2011-12 | 48 | 4.9 | 153 | 15.5 |
| 2012-13 | 54 | 5.1 | 125 | 11.8 |
| 2013-14 | 51 | 3.8 | 116 | 8.6 |
| 2014-15 | 26 | 1.7 | 101 | 6.5 |
| 2015-16 provisional | 34 | 2.0 | 110 | 6.4 |
| Wood products | ||||
| 2011-12 | 161 | 3.1 | 654 | 12.4 |
| 2012-13 | 141 | 2.3 | 491 | 9.0 |
| 2013-14 | 155 | 2.8 | 523 | 9.6 |
| 2014-15 | 136 | 2.4 | 510 | 8.9 |
| 2015-16 provisional | 128 | 2.5 | 558 | 10.9 |
| Pulp, paper & paper products | ||||
| 2011-12 | 90 | 1.6 | 393 | 6.9 |
| 2012-13 | 76 | 1.4 | 323 | 5.9 |
| 2013-14 | 85 | 1.5 | 322 | 5.8 |
| 2014-15 | 75 | 1.3 | 303 | 5.4 |
| 2015-16 provisional | 67 | 1.4 | 284 | 6.1 |
Source: Health & Safety Executive.
Notes:
1. Categories are based on the UK Standard Industrial Classification(SIC 2007) categories. Further details on the SIC codes used are provided in the Sources: Employment and businesses page.
2. Excludes other wood-using industries.
3. Major accidents include fatal accidents, which averaged around 1 per year for forestry and wood processing, and was lower for pulp, paper and paper products.
4. As a result of a change in reporting requirements, data from 2012-13 is not directly comparable with previous years.
Figure 7.1 Accidents to employees : Total reported accidents per 1000 employees
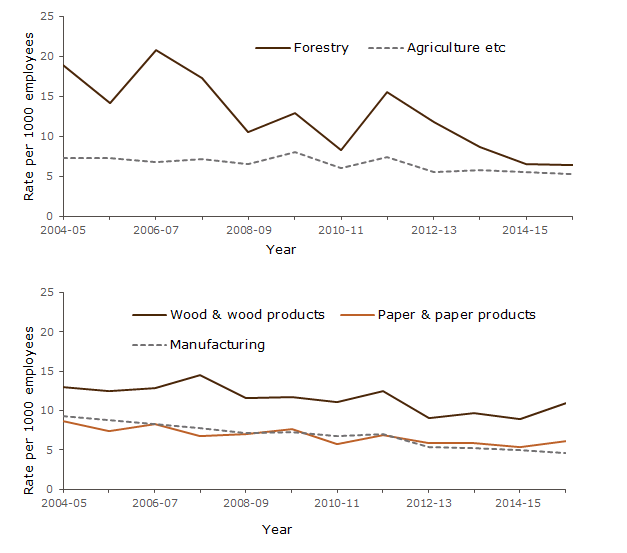
Source: Health & Safety Executive.
Notes:
1. Categories are based on the UK Standard Industrial Classification(SIC 2007) categories. Further details on the SIC codes used are provided in the Sources: Employment and businesses page.
2. As a result of a change in reporting requirements, data from 2012-13 is not directly comparable with previous years.