Tools and Resources
In 2017, deliveries of UK roundwood (softwood and hardwood) totalled 11.2 million green tonnes, a 2% increase from the previous year (Tables 2.5 and 2.6).
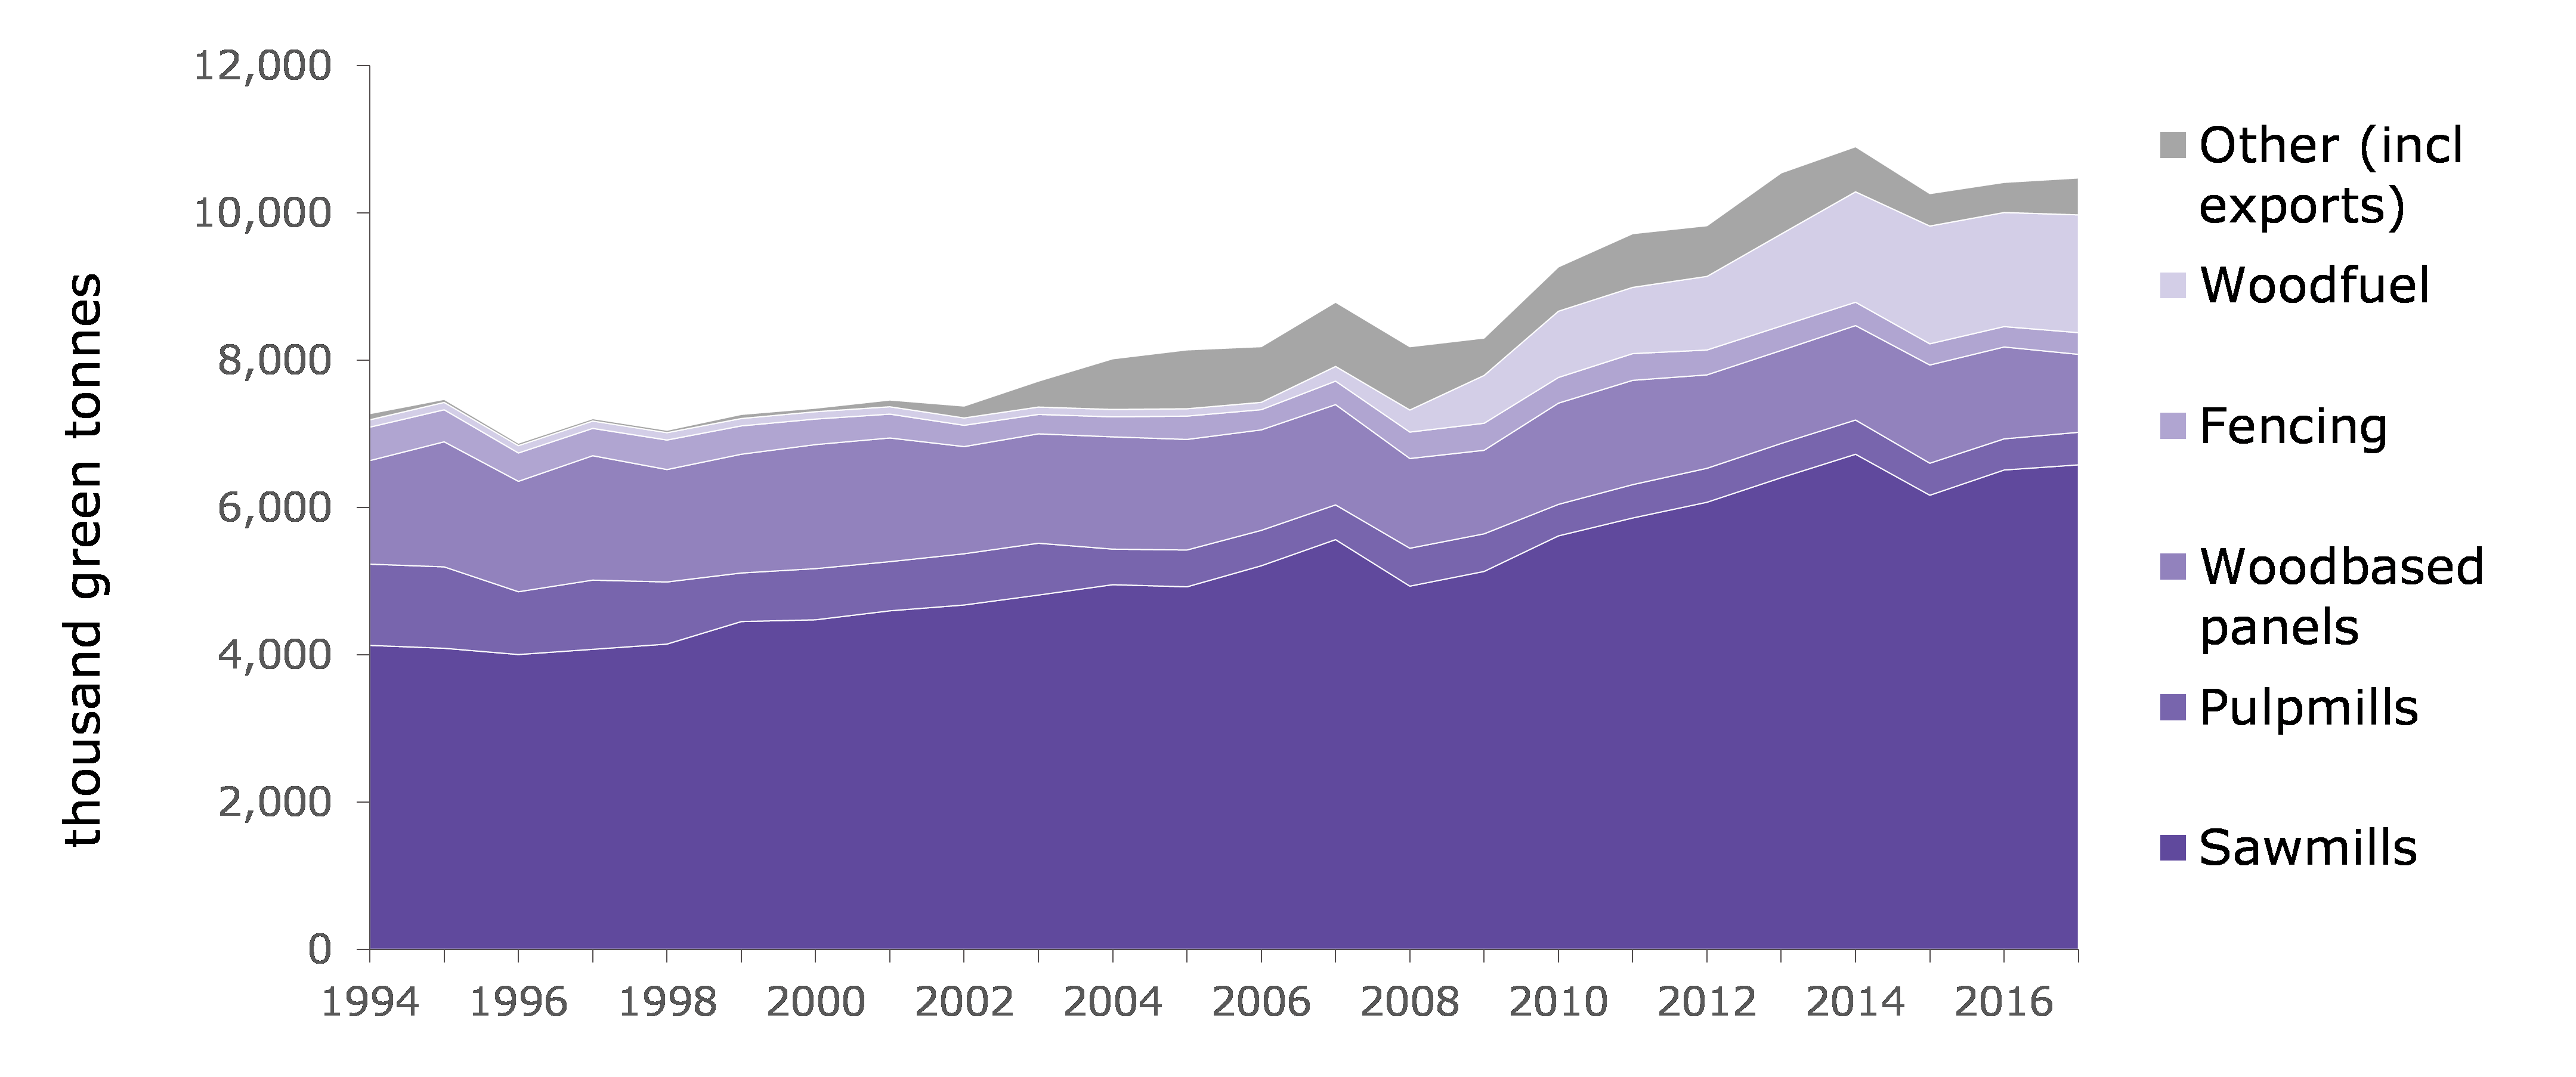
Most UK roundwood deliveries (93%) were softwood and totalled 10.5 million green tonnes in 2017 (Table 2.5). 6.6 million green tonnes (63% of UK softwood deliveries) were used by sawmills, a 1% increase from the previous year. A further 1.6 million green tonnes were used for wood fuel (3% increase), 1.1 million green tonnes were used to produce wood-based panels (15% decrease), 0.4 million green tonnes by integrated pulp and paper mills (a 4% increase), and 0.8 million green tonnes for other uses (16% increase), including round fencing, shavings and exports of roundwood.
The increase in softwood deliveries for woodfuel in recent years reflects an increase in wood use for heating and energy production in the UK (see the Sources’ chapter for further information).
Table 2.5 Deliveries of UK-grown softwood, 2008-2017
| Year | Sawmills | Pulp mills | Wood-based panels |
Fencing | Woodfuel1 | Other2 | Exports | Total |
| thousand green tonnes | ||||||||
| 2008 | 4933 | 515 | 1219 | 359 | 300 | 128 | 733 | 8187 |
| 2009 | 5133 | 511 | 1135 | 367 | 650 | 160 | 347 | 8304 |
| 2010 | 5616 | 428 | 1375 | 349 | 900 | 135 | 467 | 9269 |
| 2011 | 5859 | 453 | 1417 | 363 | 900 | 145 | 585 | 9722 |
| 2012 | 6073 | 461 | 1269 | 338 | 1000 | 154 | 535 | 9831 |
| 2013 | 6407 | 465 | 1263 | 332 | 1250 | 191 | 640 | 10547 |
| 2014 | 6725 | 465 | 1283 | 317 | 1500 | 176 | 437 | 10903 |
| 2015 | 6168 | 435 | 1334 | 288 | 1600 | 164 | 276 | 10265 |
| 2016 | 6511 | 423 | 1248 | 277 | 1550 | 178 | 231 | 10419 |
| 2017 | 6581 | 442 | 1059 | 295 | 1600 | 170 | 331 | 10478 |
Source: industry surveys, industry associations.
Notes:
1. Woodfuel derived from stemwood, includes estimates of roundwood use for biomass energy. The figures are estimated by the Expert Group on Timber and Trade Statistics, and make use of woodfuel data reported in the Private Sector Softwood Removals Survey.
2. Includes shavings and poles. Quantities for some uses are estimates by the Expert Group on Timber and Trade Statistics.
Figure 2.1 Deliveries of UK-grown softwood, 1994-2017
Source: industry surveys, industry associations.
Experimental statistics on the destination of softwood (wood from conifer trees) removed from UK forests by country are available in the Excel spreadsheets that accompany this report.
Sources chapter: Timber