Table 3.8 presents data on the source of selected wood products that have been imported into the UK in 2016.
Sawn softwood, particleboard, fibreboard, and paper and paperboard were overwhelmingly imported from EU countries in 2016 (Table 3.8):
Sawn hardwood and wood pulp imports originated from a range of both EU and non-EU countries in 2016:
The vast majority of UK imports of plywood and wood pellets came from countries outwith the EU in 2016:
Table 3.8 Country of origin of wood imports to the UK, 2016
| Source | Sawn softwood | Sawn hardwood | Plywood | Particle-board | Fibre-board | Pellets | Wood pulp | Paper and paperboard |
| per cent of total UK imports (volume) in each category | ||||||||
| Sweden | 43 | 0 | 0 | 0 | 0 | 0 | 20 | 15 |
| Germany | 6 | 5 | 1 | 23 | 24 | 0 | 4 | 17 |
| Finland | 14 | 1 | 9 | 0 | 1 | 0 | 3 | 17 |
| Latvia | 17 | 4 | 2 | 20 | 4 | 14 | 0 | 0 |
| France | 0 | 7 | 1 | 17 | 1 | 0 | 0 | 7 |
| Austria | 0 | 1 | 1 | 1 | 1 | 0 | 15 | 3 |
| Italy | 0 | 9 | 1 | 1 | 0 | 0 | 1 | 4 |
| Belgium | 0 | 1 | 1 | 12 | 9 | 0 | 0 | 3 |
| Ireland | 6 | 1 | 1 | 9 | 32 | 0 | 0 | 1 |
| Spain | 0 | 0 | 1 | 2 | 14 | 0 | 2 | 2 |
| Portugal | 0 | 0 | 0 | 9 | 1 | 2 | 1 | 2 |
| Estonia | 1 | 12 | 0 | 0 | 1 | 3 | 0 | 0 |
| Other EU-28 | 4 | 9 | 2 | 4 | 8 | 1 | 7 | 7 |
| Total EU-28 | 92 | 50 | 19 | 98 | 94 | 21 | 54 | 76 |
| USA | 0 | 24 | 0 | 0 | 0 | 58 | 2 | 4 |
| Canada | 1 | 4 | 1 | 0 | 0 | 20 | 0 | 4 |
| China | 0 | 0 | 40 | 0 | 1 | 0 | 0 | 1 |
| Brazil | 0 | 0 | 19 | 0 | 0 | 0 | 34 | 2 |
| Russia | 6 | 1 | 6 | 2 | 0 | 1 | 0 | 1 |
| Malaysia | 0 | 5 | 6 | 0 | 0 | 0 | 0 | 0 |
| Cameroon | 0 | 9 | 0 | 0 | 0 | 0 | 0 | 0 |
| Other non-EU | 1 | 8 | 9 | 0 | 4 | 0 | 9 | 12 |
| Total non-EU | 8 | 50 | 81 | 2 | 6 | 79 | 46 | 24 |
Source: UK overseas trade statistics (HM Revenue & Customs), industry associations.
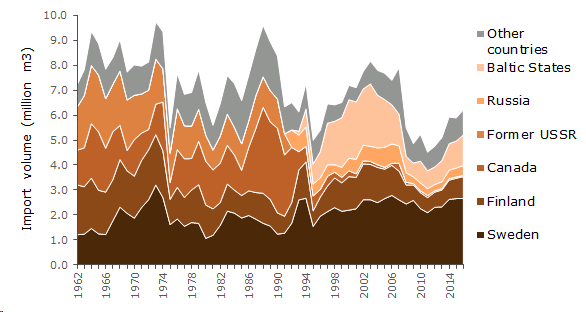
Figure 3.2 shows the main sources of imports of sawn softwood to the UK since 1962. The total level of sawn softwood imports has fluctuated over the period, between around 5 million m3 and 10 million m3. Imports from Canada have reduced since the early 1990s; those from the Baltic States have increased between 1992 and 2003 then, after a general decline to 2012, have started to increase again in recent years. Sweden has consistently been the principal country of origin for UK sawn softwood imports since 1993.
Figure 3.2 Country of origin of sawn softwood imports to the UK, 1962-2016

Source: FAO, UK overseas trade statistics (HM Revenue & Customs), industry associations.