We use some essential cookies to make this website work.
We’d like to set additional cookies to understand how you use forestresearch.gov.uk, remember your settings and improve our services.
We also use cookies set by other sites to help us deliver content from their services.
The global forest area reduced by around 7.3 million hectares (0.2%) per year between 1990 and 2000, by around 4.0 million hectares (0.1%) per year between 2000 and 2010 and by around 3.3 million hectares (0.1%) per year between 2010 and 2015 (Table 9.2).
The forest area has reduced in most regions since 1990, except for Europe (where the area increased in each time period) and Asia (where the area reduced between 1990 and 2000 but has increased by more between 2000 and 2015).
Table 9.2 Annual changes in forest area by region, 1990-2015
| Region | 1990-2000 | 2000-2010 | 2010-2015 | |||
| (thousand ha) | (%) | (thousand ha) | (%) | (thousand ha) | (%) | |
| Europe | ||||||
| UK | 18 | 0.6 | 11 | 0.3 | 17 | 0.5 |
| EU-281 | 681 | 0.5 | 450 | 0.3 | 369 | 0.2 |
| Total Europe | 803 | 0.1 | 1127 | 0.1 | 382 | 0.0 |
| Africa | -3537 | -0.5 | -3209 | -0.5 | -2836 | -0.4 |
| Asia | -221 | 0.0 | 2349 | 0.4 | 791 | 0.1 |
| North and Central America | -394 | -0.1 | 172 | 0.0 | 75 | 0.0 |
| Oceania | 82 | 0.0 | -564 | -0.3 | 304 | 0.2 |
| South America | -4000 | -0.4 | -3868 | -0.4 | -2024 | -0.2 |
| World | -7267 | -0.2 | -3993 | -0.1 | -3308 | -0.1 |
Source: FAO Global Forest Resources Assessment 2015.
Notes:
1. Cyprus is included in EU-28 total but is part of FAO’s Asia region.
2. UK figures for 2015 are 2013-based estimates. Revised estimates (from Chapter 1) suggest that Table 9.2 slightly under-estimates the change in forest area in the UK in the most recent time period.
These figures are outside the scope of National Statistics
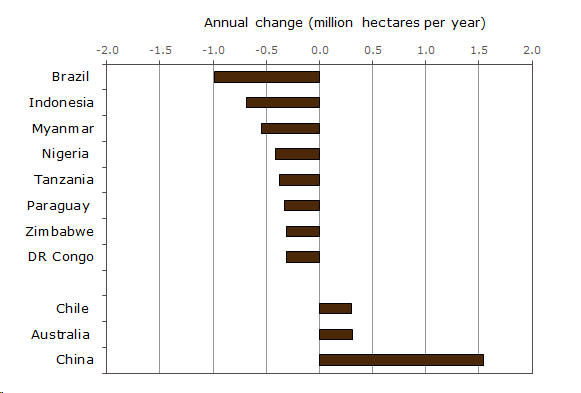
Between 2010 and 2015, the largest decrease in forest area was in Brazil (1.0 million hectares per year on average) and the largest increase was in China (1.5 million hectares per year on average) (Figure 9.3).
Figure 9.3 Countries with the largest changes in forest area, 2010-2015

Source: FAO Global Forest Resources Assessment 2015.
Notes:
1. Countries with changes of at least 0.3 million hectares per year only.
These figures are outside the scope of National Statistics
Cookies are files saved on your phone, tablet or computer when you visit a website.
We use cookies to store information about how you use the dwi.gov.uk website, such as the pages you visit.
Find out more about cookies on forestresearch.gov.uk
We use 3 types of cookie. You can choose which cookies you're happy for us to use.
These essential cookies do things like remember your progress through a form. They always need to be on.
We use Google Analytics to measure how you use the website so we can improve it based on user needs. Google Analytics sets cookies that store anonymised information about: how you got to the site the pages you visit on forestresearch.gov.uk and how long you spend on each page what you click on while you're visiting the site
Some forestresearch.gov.uk pages may contain content from other sites, like YouTube or Flickr, which may set their own cookies. These sites are sometimes called ‘third party’ services. This tells us how many people are seeing the content and whether it’s useful.