We use some essential cookies to make this website work.
We’d like to set additional cookies to understand how you use forestresearch.gov.uk, remember your settings and improve our services.
We also use cookies set by other sites to help us deliver content from their services.
Returns to investors in forestry are made up of sales of timber (standing or felled), sales of other goods and services, increases in the value of the woodland (from annual increment or market factors), and the net income from subsidies (e.g. planting grants) less taxes. The investors’ costs are made up of employment costs and other purchases.
Estimates of the overall return from commercial forestry are produced annually in the Investment Property Databank (IPD) UK Forestry Index, available at www.msci.com/www/ipd-factsheets/ipd-uk-annual-forestry-index/0163322597. The index is calculated from a sample of around 150 private sector coniferous plantations of predominantly Sitka spruce in mainland Britain. The IPD UK Forestry Index is outside the scope of National Statistics.
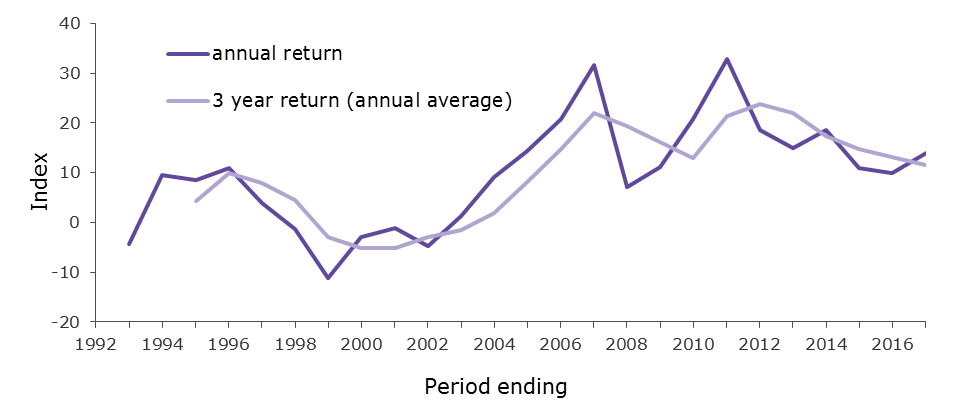
The index shows a total return of 11.6% per annum for the three-year period 2015 to 2017, and an annual return of 13.9% for 2017 (Table 8.2).
Table 8.2 IPD UK Forestry Index: Returns from forestry, 2008-2017
| Period ending | Index (1992=100) | Annual % return | 3 year return (annual average %) |
| 2008 | 226.5 | 7.1 | 19.3 |
| 2009 | 251.9 | 11.2 | 16.1 |
| 2010 | 304.2 | 20.8 | 12.9 |
| 2011 | 404.2 | 32.9 | 21.3 |
| 2012 | 479.6 | 18.6 | 23.9 |
| 2013 | 551.2 | 14.9 | 21.9 |
| 2014 | 653.6 | 18.6 | 17.4 |
| 2015 | 725.2 | 10.9 | 14.8 |
| 2016 | 797.0 | 9.9 | 13.1 |
| 2017 | 907.8 | 13.9 | 11.6 |
Source: IPD UK Forestry Index
These figures are outside the scope of National Statistics. For further information see the Sources chapter.
Figure 8.2 IPD UK Forestry Index: Returns from forestry

Source: IPD UK Forestry Index
Note:
1. Data collected for the IPD UK Forestry Index started in 1992
These figures are outside the scope of National Statistics. For further information see the Sources chapter.
Sources chapter: Finance & prices
Cookies are files saved on your phone, tablet or computer when you visit a website.
We use cookies to store information about how you use the dwi.gov.uk website, such as the pages you visit.
Find out more about cookies on forestresearch.gov.uk
We use 3 types of cookie. You can choose which cookies you're happy for us to use.
These essential cookies do things like remember your progress through a form. They always need to be on.
We use Google Analytics to measure how you use the website so we can improve it based on user needs. Google Analytics sets cookies that store anonymised information about: how you got to the site the pages you visit on forestresearch.gov.uk and how long you spend on each page what you click on while you're visiting the site
Some forestresearch.gov.uk pages may contain content from other sites, like YouTube or Flickr, which may set their own cookies. These sites are sometimes called ‘third party’ services. This tells us how many people are seeing the content and whether it’s useful.