Summary
How we manage priority habitats within increasingly fragmented landscapes is a critical conservation issue. Practitioners and policymakers are often faced with the dilemma of deciding where to focus limited resources, but evidence on where particular actions will have the largest return on investment is lacking. To aid this decision-making process, we have developed a spatial framework in the open source programming environment R for measuring and combining indicators of habitat biodiversity, coherence and resilience.
Research Objectives
- Develop an adaptable indicator-based framework that embeds landscape ecology theory and a triage approach to inform cost-effective, targeted restoration under various decision-making contexts.
- Develop a user-friendly front-end for this framework in the form of R Shiny online web applications (R Shiny Apps).
Latest Update
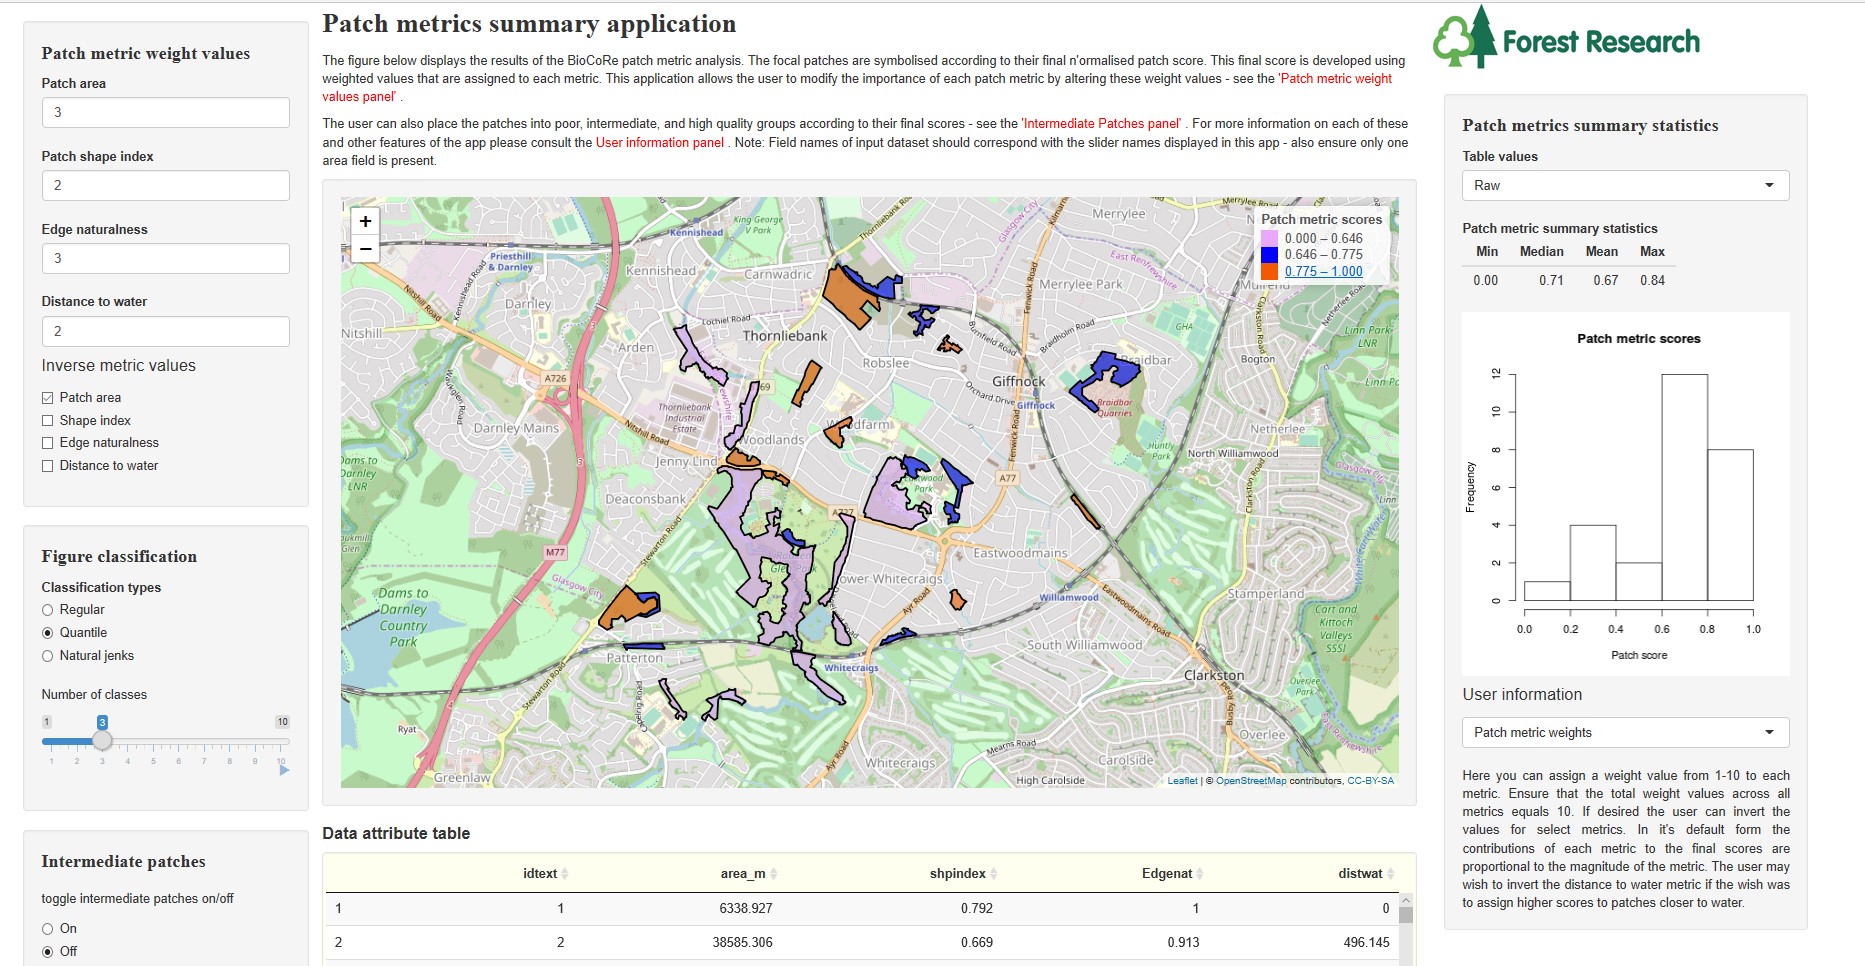
We have two operating prototype applications available for you to test:
General Content
Background:
Spatially targeted decision-making
Information on where land management actions are likely to most effective in supporting biodiversity is often lacking. This limits our ability to act strategically at various scales of decision-making, from the development of long-term, nationwide habitat networks and the distribution of associated incentives, to more local decisions by landowners and managers on the prescription of resources. If we are to meet national and international targets to reduce biodiversity decline and to restore ecosystems with the limited resources available, scientifically grounded, accessible landscape decision-making tools are required.
BioCoRe
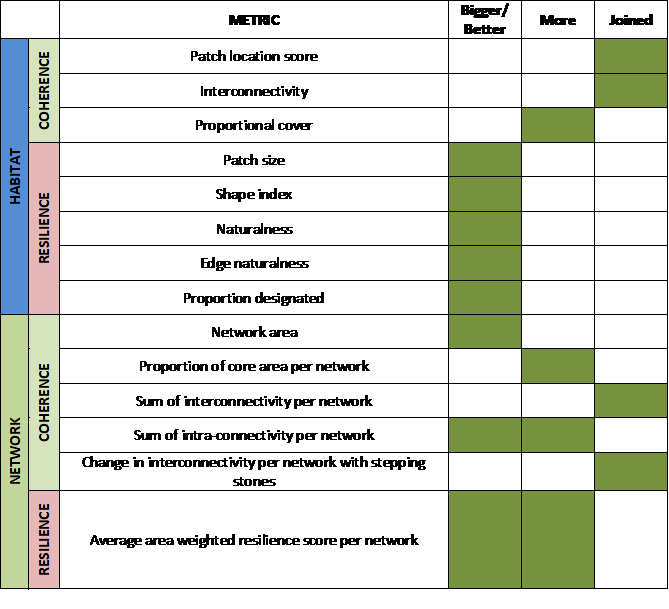
Local ‘patch’ scale indicators of habitat quality or condition are often compared in isolation from important information on the composition and spatial configuration of the surrounding landscape. BioCoRe uses spatial-environmental data to measure both patch- and network-scale indicators of habitat Biodiversity, Coherence and Resilience according to the Lawton Principles of ‘more, bigger, better and joined’ habitat (Lawton, 2010; see examples in table below). It allows users to create ‘least cost’ ecological networks based on the distances between patches and the permeability of the intervening habitat (Watts et al., 2010). Users can then map and compile these indicators and apply a triage approach to identify areas where restoration and conservation actions are likely to be most cost effective.
A flexible, interactive approach
In recognition of the fact that priorities, goals, evidence and data availability vary between decision-making contexts, our suite of interactive BioCoRe Shiny Apps enable end users to analyse their own data and to explore the impact of altering model parameters on the output. Users can also run patch- and network-level analyses independently or in combination to suit different circumstances.
Case Studies
We work with a range of practitioners to apply the BioCoRe framework. Recent examples include:
- Somerset Wildlife Trust: we developed the BioCoRe approach in order to evaluate the functionality of ecological networks in the Brue Valley Living Landscape.
- CSGN/Glasgow Clyde Valley: used the BioCoRe approach to inform an assessment of quality and connectivity of habitat and functionality of ecological networks within the study landscape. Work commissioned by the Glasgow and Clyde Valley Green Network Partnership and SNH.
- Strathard – a landscape to live, work and play: We used the BioCoRe approach to assess ecological condition and connectivity of habitats within a project area encompassing the village of Aberfoyle and the surrounding area. Results were used in conjunction with ecosystem service and hydrological assessments to help inform land management actions on the ground.
Further Information
For an overview of the BioCoRe Shiny Apps, please see this video (skip to the 3 hr 15 mins mark) of Andrew at the 2019 Foss4G conference in Edinburgh.
References
- Lawton, J. H., & Brotherton, P.N.M.Brown, V.K., Elphick, C., Fitter, A.H., Forshaw, J., Haddow, R.W., Hilborne, S., Leafe, R.N., Mace, G.M., Southgate, M.P., Sutherland, W.J., Tew, T.E., Varley, J., & Wynne, G. R. (2010). Making space for nature: A review of England’s wildlife Sites and ecological network. Report to Defra, (September).
- Watts K, Handley P (2010) Developing a functional connectivity indicator to detect change in fragmented landscapes. Ecol Indic 10:552–557. doi: 10.1016/j.ecolind.2009.07.009