Tree Species Guide for UK Agroforestry Systems
This tree species guide, developed in partnership with the University of Reading following a rapid review of literature, databases, and…
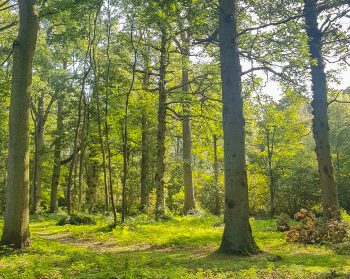
Researchers have explored the ecological outcomes of woodland creation using natural processes and land managers’ social perceptions of the approach in new research published.
Explore the research

New research to understand the existing provision of public access to woodlands in England, as well as opportunities for increasing access, has been published by Forest Research
Scientists at Forest Research and Aberystwyth University, in partnership with Sylva Foundation, are asking woodland owners and managers to take part in an important new research project to monitor the health of oak trees.
A new survey reveals that while most people value the environmental and societal importance of plants and trees and are concerned about pests and diseases, this concern rarely translates into personal action.
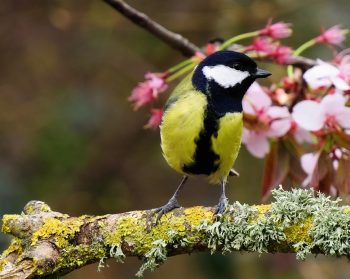
Planting woodland adjacent to established woodland or in large clumps is more likely to boost bird populations than random planting, modelling suggests.
Discover our Climate Change Hub, a comprehensive, evidence-based resource that brings together climate change adaptation advice for forest and woodland owners and managers in the UK.

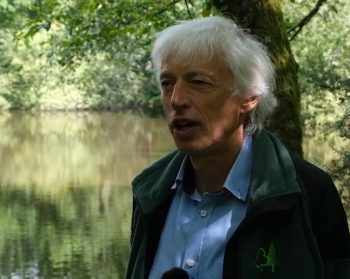
Imagine a job where every day is different, where science meets policy, and where your work makes a real impact. Mariella Marzano, Principal Social Scientist, tells us why she loves her role at Forest Research.
Matt Wilkinson explains how Forest Research's NCEA Programme is leading the way by using cutting-edge science to assess and protect England's ecosystems.
Tom Nisbet, Head of Physical Environmental Sciences, details how the new UKFS Practice Guide supports the creation and management of riparian woodlands to protect waterways and enhance biodiversity.

Stay ahead of the threat with TreeAlert’s new dashboard for real-time insights on tree pests and diseases across Great Britain.

Detection dogs have been used in the UK to successfully identify tree disease, helping track down the deadly tree pathogen Phytophthora ramorum.

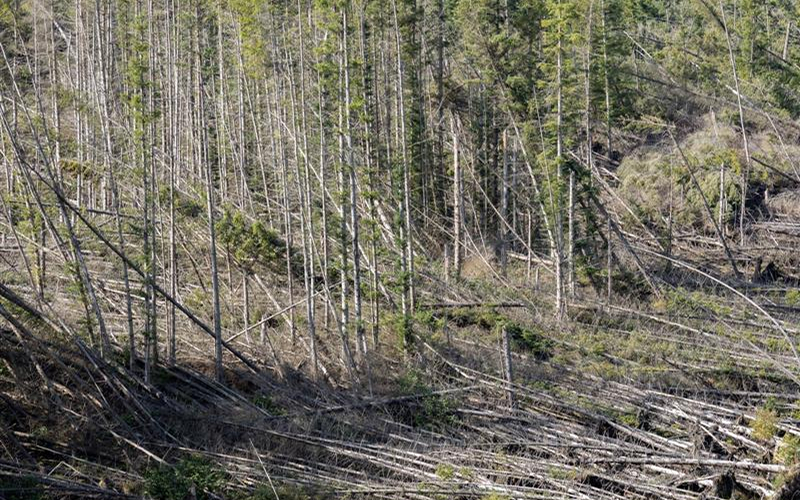
Plan smarter, grow stronger. Senior Climate Change Scientist Tom Locatelli explains how ForestGALES helps foresters tackle wind risk and build resilient woodlands in Great Britain, and beyond.
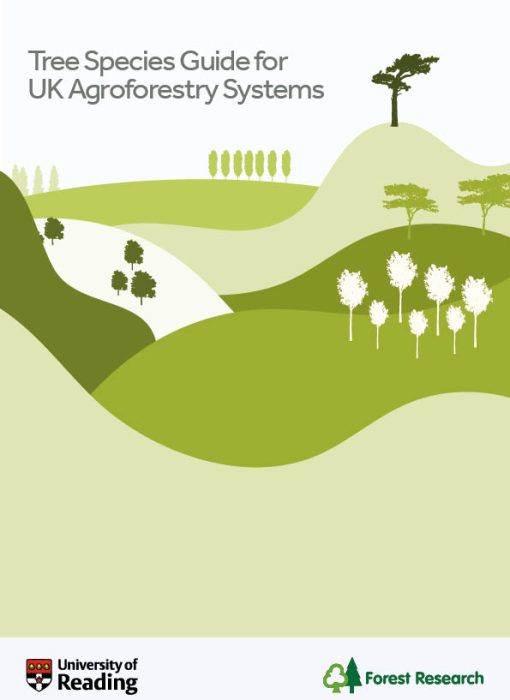
This tree species guide, developed in partnership with the University of Reading following a rapid review of literature, databases, and…
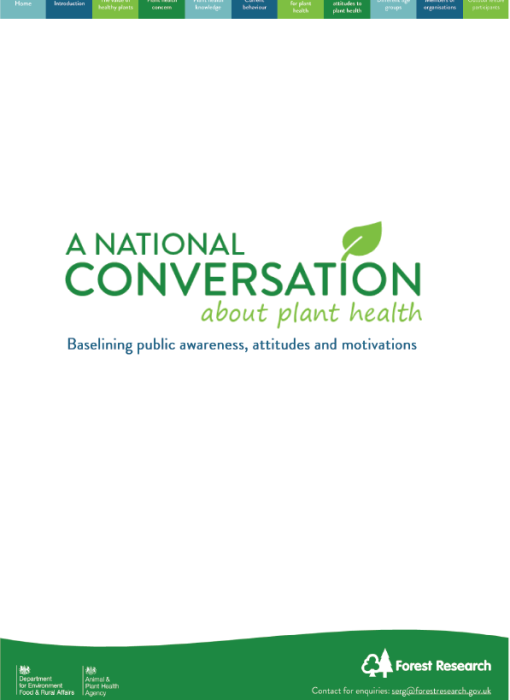
This report summarises the results of a national baseline survey on public attitudes to plant health.
This booklet summarises statistics on woodland and forestry, covering areas such as woodland size, timber products, economics, and environmental factors,…
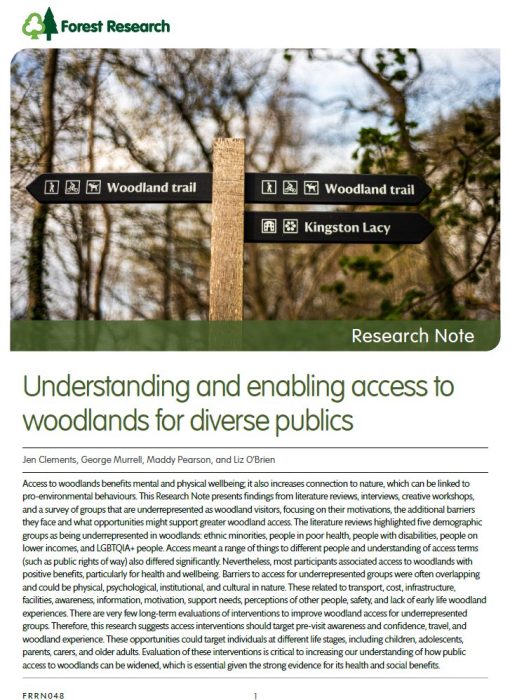
This Research Note presents findings from research with groups that are underrepresented as woodland visitors; focusing on their motivations, the…
Lead Author: Jen Clements
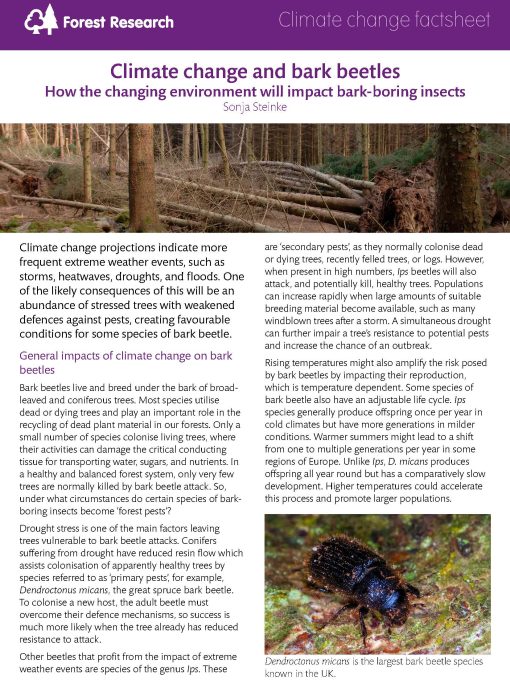
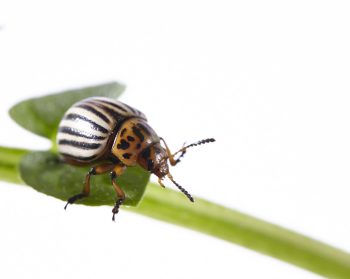
How will the changing environment impact bark-boring insects? Climate change projections indicate more frequent extreme weather events, such as storms,…
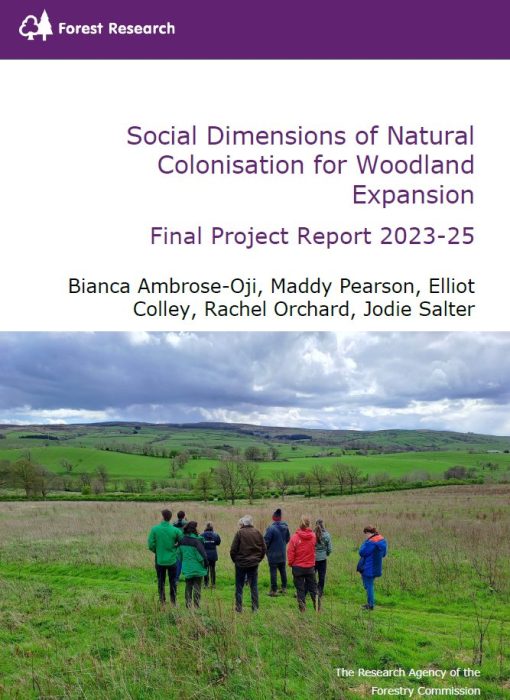
This report describes the outcomes of a recent Forest Research project which aimed to improve understanding of land managers decision-making…
Lead Author: Bianca Ambrose-Oji
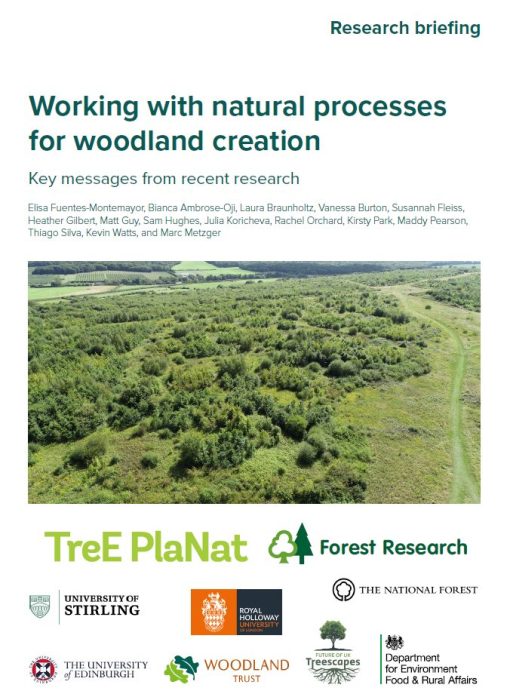
This report presents ten key insights about working with natural processes for woodland creation that have emerged from our research.
Lead Author: Bianca Ambrose-Oji
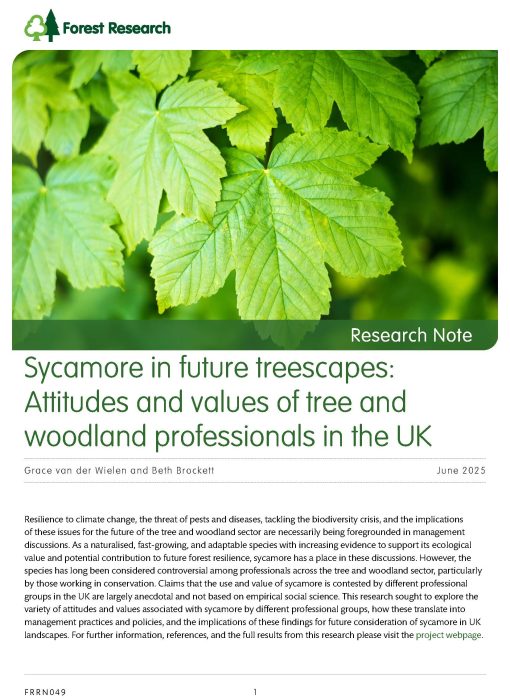
Overview Resilience to climate change, the threat of pests and diseases, tackling the biodiversity crisis, and the implications of these…
Lead Author: Grace van der Wielen
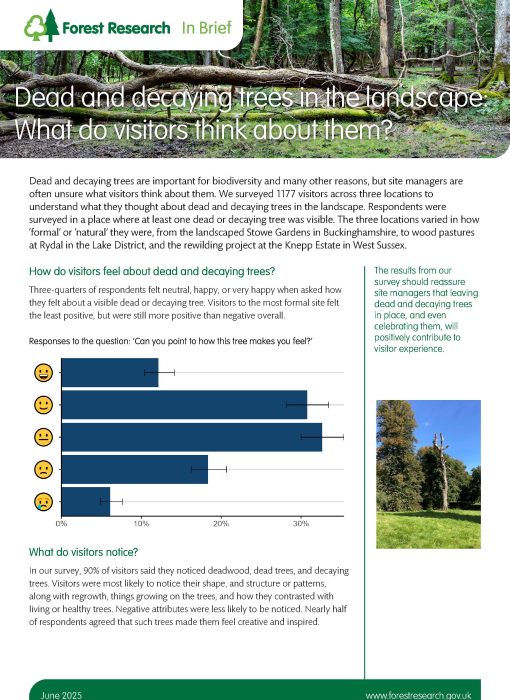
This In Brief explores the results from a survey of 1177 visitors across three locations to understand what they thought…
Lead Author: Beth Brockett
This document is an Annex to the Welsh Plant Health Surveillance Network Programme 2022 Review, and reports on the third…
Lead Author: Racheal Lee
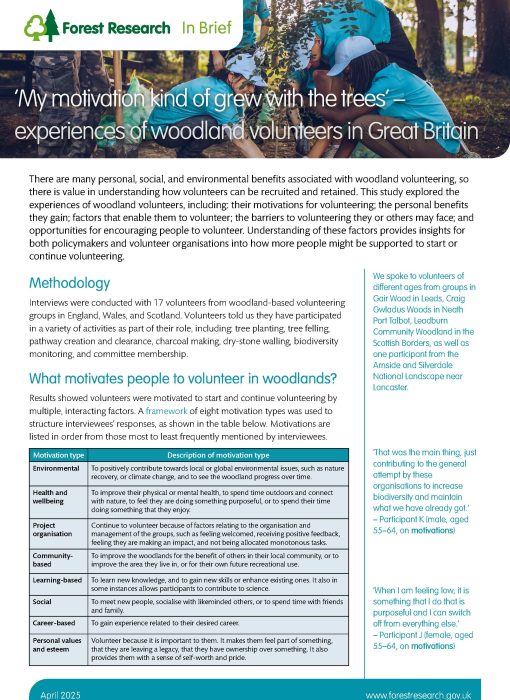
This In Brief explores experiences of woodland volunteers in Great Britain, providing insights into how people might be supported to…
Lead Author: George Murrell
Work at the cutting-edge of environmental science research with Forest Research, Great Britain’s leading organisation for forestry and tree-related research.

Author(s): Elliot Colley, Emma Hinton, Nora Kerecsenyi, Darren Moseley, Liz O'Brien
Author(s): Nadia Barsoum
Author(s): Tom Nisbet, Gregory Valatin, Romany Vassell, Robert Hattersley

Author(s): Stephen McConnachie, Maddy Pearson, Harry Marshall, Beth Brockett, Grace van der Wielen
Author(s): Nadia Barsoum
Author(s): Liz O'Brien
Author(s): Gregory Valatin, Vadim Saraev, Robert Hattersley, Wen Hao Low, Eleanor Gardner
Author(s): Joan Webber
Author(s): Ana Perez-Sierra, Joan Webber
Author(s): Beth Brockett, Alice Broome, Kate Beauchamp, Stephen McConnachie, Matt Guy
Learn how Ash Dieback is impacting Great Britain's native ash trees, and discover resources to help slow its spread.
Understand the threat of Oak Processionary Moth to the country’s oak trees and access key information on its management and control.
Explore this detailed resource with information on common tree pests and diseases, from Acute Oak Decline to the Asian Longhorn Beetle.
Access a detailed database on information on over 60 tree species that are either widely grown in British forests or which could play an increasing role in the future.
Explore ForestGALES, a computer tool that assesses wind damage risk to forests in Britain, allowing comparison of different silvicultural practices.
Discover vital insights about Britain’s woodlands through the National Forest Inventory (NFI), a comprehensive programme offering up-to-date data on forest size, distribution, health, and biodiversity.
We carry out research to develop a better understanding of the ways in which trees and woodlands can benefit society
Chemical analysis of plant, water and soil samples, testing of plant stock quality and tree assessment products
The Tree Health Diagnostic and Advisory Service provide advice and where possible diagnosis and identification of tree pest and pathogen
By analysis of DNA extracted from samples, Forest Research can identify the presence of cryptic or reclusive species.
The Land Use and Ecosystem Services Research Group provides services to the forestry and environment sectors.